|
|
|
The below talk by UC Davis Neuroscientist Matthias Gruber encapsulates all that currently fascinates and motivates me as an educator. I hope you enjoy!
Pennies made after 1982 are ~ 95% zinc with a plated copper exterior. Thus, a penny contains two metals and can, if manipulated properly, be converted into a battery. See video below:
This video is LEGIT, and upon seeing it, my gut was to provide students with this video, the materials, and let them go at it as an introduction to our unit on energy in Biology class. (Mitochondria metaphor, etc.).
Then I remembered the research on curiosity! The goal is to intentionally withhold the IDEAL amount of information. Peak interest, but create suspense. Provide enough information as to not demotivate, but leave enough out as to keep the learner guessing. The below "inverted U" graph of Curiosity vs. Knowledge (knowledge confidence), provides a great visual. Inspect it carefully. Have all the info. Not curious. Have no info. Not curious. Withhold the ideal amount. Curious. 
So, back to the initial activity. I fear that if I give students the above video, as awesome as it is, the activity will transition from science to "arts and crafts".
I fear that by providing the video, I will provide too much information, push students to the far right of the "inverted U" and minimize curiosity. DESPITE how engaging the activity is! The engagement lies not in the video quality, or the task, but the anticipation of what will happen. The frustration in not knowing exactly what will happen, or how to do it. The tension that is built when the instructor perfectly provides and withholds. The cognitive reward the learner receives when that tension is revealed. We all love solving riddles. This is the true "Call to Adventure". So here is what I'm going to do instead. Step 1: Tell students that electrons can flow spontaneously through a material when two different metals are connected through a conductive solution. Step 2: Tell students that pennies after 1982 are platted with copper. Step 3: Provide students with the exact materials shown in the screenshot from the video above. Include the video title "How to Make a Penny Battery from Start to Finish" in the below image as a strategy for pushing students directly under the "inverted U" shown above. 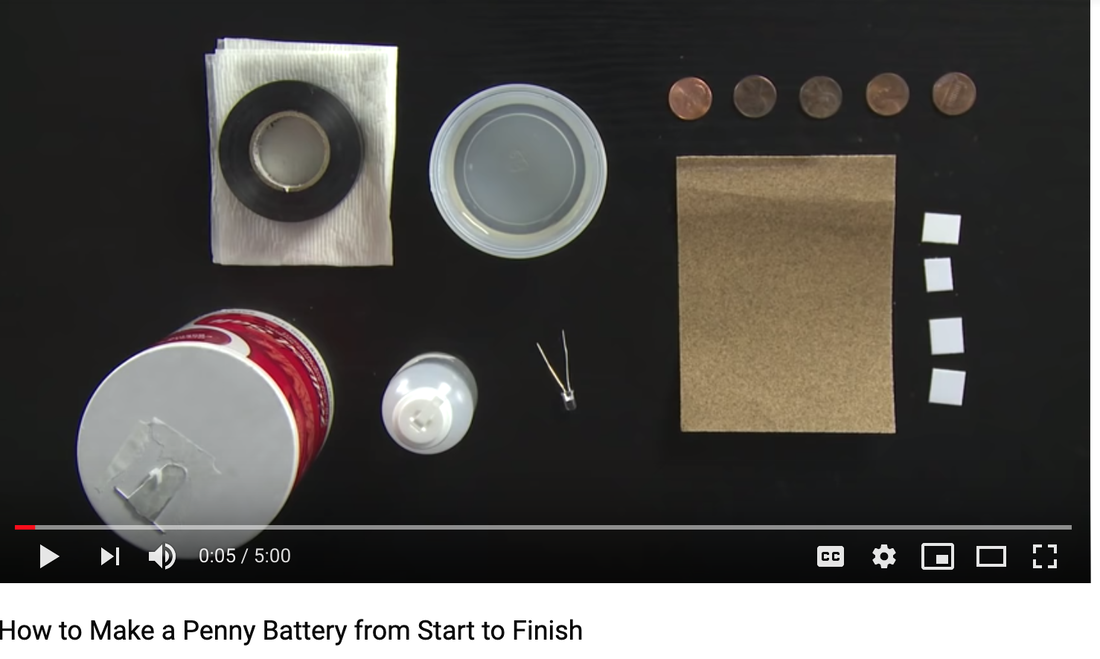
Step 4: Challenge students to light the LED using only the materials provided in the above image. Remove internet privileges to ensure that information is strategically withheld and students do not look up the above video.
Step 5: Play the above video. Step 6: Treat this as the first two"Es" (Engage and Explore) in the 5E Learning cycle. Continue on with lesson. Etc., etc.
*Note: The below lesson is only an outline meant to encourage deeper thinking about the 5E cycle.
Standard
NGSS: HS-LS2-3: Construct and revise an explanation based on evidence for the cycling of matter and flow of energy in aerobic and anaerobic conditions. 1. Engage
Display the below image and ask the question: What are you curious about?
Desired student questions include, but are not limited to, the below:
*Purpose: To surface content related questions without explicitly asking students. 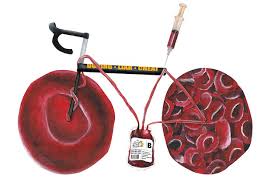
2. Explore
Teach how to leverage Arduino Uno to create their own Pulse Oximeter. Click here for instructions and materials. Once complete challenge students to design and conduct an experiment to determine the impact that various types of exercises and activities (breathing through a straw, etc.) have on pulse and oxygen saturation. Students will then hypothesize the relationship between pulse, oxygen saturation and energy use. Experiment must be conducted using appropriate research design methodology. (Control, independent, dependent variables outlined clearly)
*Purpose: To challenge students to think deeper about energy during exercise and strain, as well as revisit research methodology and promote crosscutting NGSS integration such as engineering, etc. into the lesson. By not addressing "Blood Doping" directly, students are left wondering the relationship between the "Engage" and "Explore" phase further intensifying their curiosity and desire for more content. 3. Explain
Conduct a lesson on Cellular Respiration, clearly outlining and diagraming the process of Glycolysis, Krebs cycle, and defining organelles such as the cytosol and the mitochondria. Once complete, ask the driving question: How does the processes outlined relate to "Blood Doping". After students share their responses, play the video below:
*Purpose: To deliver basic content (diagrams, processes, vocabulary) to help students make a deeper connection between the "Engage" and "Explore" phases.
4. Extend
Pose the below medical case study to students and challenge them to:
A, 23-year-old, 5’ 9”, 105 lb, caucasian female presented in her physician’s office with a sudden onset of weight loss along, pain when urinating, and chronic extreme hunger. The patient also reported a strange mold-like substance forming in her toilet over the past week. *Purpose: To facilitate connection between information obtained during the "Explain" phase and applications of content in the "real world" (note: I hate the term "real world" but application can extend beyond medical diagnostics, etc.). 5. Evaluate
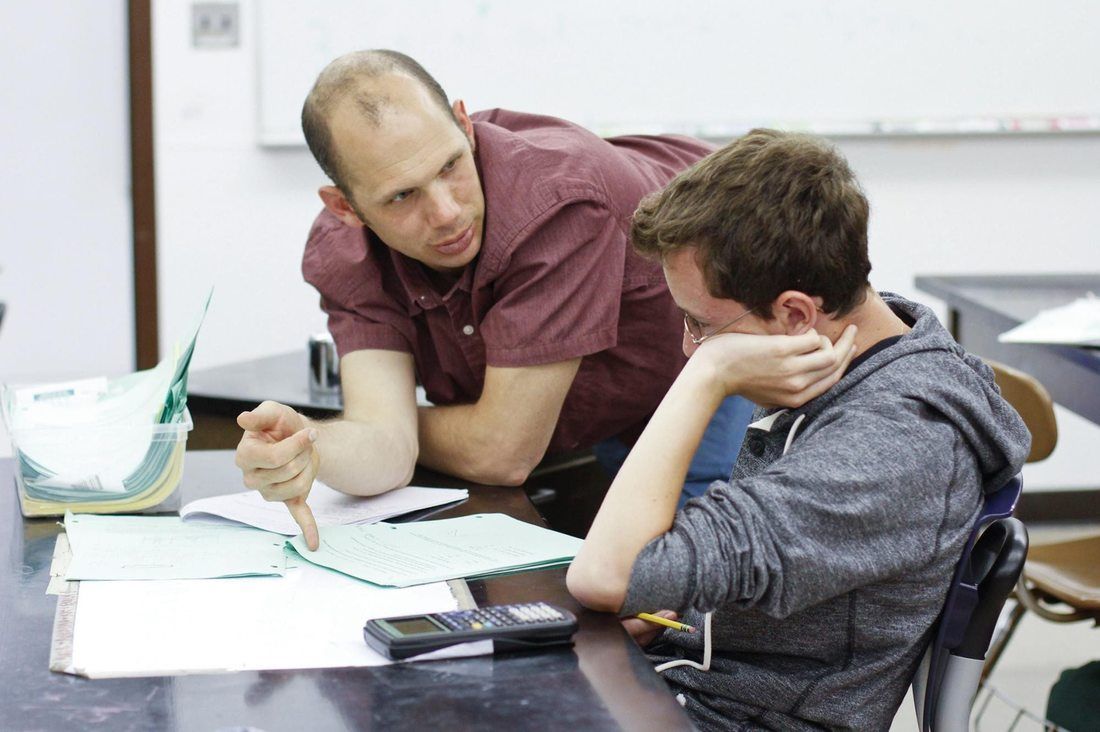
As a science teacher, I often get the following statement when working with other educators: "Sparking student interest in the Sciences is just easier. You get to show cool demonstrations and stuff...".
Yes, this is very true. It can be easier. BUT, I recently had an incredible conversation with a Humanities teacher at my school, and she shared some incredible great resources for leveraging data visualization a method for sparking student curiosity in the humanities. If you are not familiar with data visualization, check out this talk. By finding a visualization, downloading it, removing specific information (titles, legends, keys, etc.) and displaying it to students, questions emerge. For example, this visualization of drought patters over the course of the past 100 years in America can be a powerful spark to build student interest in the Dust Bowl. Show students the image, say: "What are your curious about?". Questions will emerge that will vary but ultimately, because of the nature of the visualization, students will not only ask "What does the orange region represent?", they will also notice that similarities exist between the the 1940s and parts of the 2000s. Questions will emerge related to differences in farming practices, the economy, polities, etc. Suddenly a conversation related to the core causes of the Dust Bowl emerges without even discussing the Dust Bowl directly. THEN, the next day (or for homework) show Ken Burn's documentary on the Dust Bowl. Delay the instruction. Delay the mentor! It's how the Hero's Journey operates. Below are some excellent Data Visualization Resources:
I have written to annoying lengths about my love for the connection between the 5E Inquiry Learning Cycle and Joseph Campbell's Hero's Journey.
The below diagram outlines the serendipitous connections between these two cycles well: 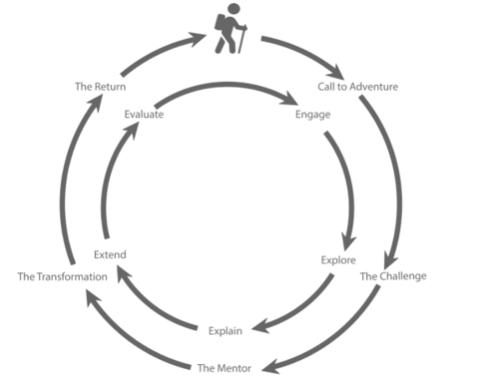
In preparation for a professional development workshop I facilitated yesterday, I created a lesson planning template based on the above connection that I am very happy with.
My hope is to use a copy of the template for each cycle I create in my biology and chemistry classes for the upcoming semester. Unlike previous templates I have used, this one leverages a Google Slide template, as a planning, rather than presentation document. The flexibility of editing slides, embedding video, etc., makes Google Slides an incredibly flexible medium. You will notice that each of the five phase of the 5E/Hero's Journey cycle hyperlinks to an associated slide. I love this feature as it creates a contained pedagogical cycle, allowing the teacher to focus on each phase individually, IN THE CONTEXT OF THE WHOLE. As an educator, this connectivity is very comforting, and as Jon Stewart said: "A structure that allows for creativity". You will notice that each slide has two portions: 1) Lesson Procedure and 2) Technology integration. By "tagging" the technology on as an afterthought, this template forces the teacher to first think pedagogically (How does this procedure serve the inquiry cycle as a whole?), then procedurally (How will I make structure the class to accomplish the goal of the specific portion in the cycle?) and finally technologically (How can I leverage technology to make this lesson even more efficient, productive, meaningful, etc.?). Thus, technology serves the pedagogy by simply following the template. An ideal teaching tool IMO. Click here and "make a copy" of the template for your own use. The template is also embedded below for ease of viewing. Enjoy! |
Ramsey Musallam is a full-time science teacher in Santa Rosa California.
Categories
All
Archives
March 2024
|
 RSS Feed