|
|
|
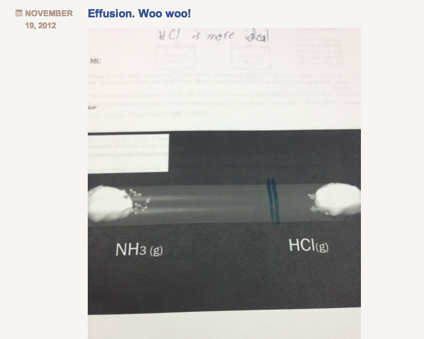
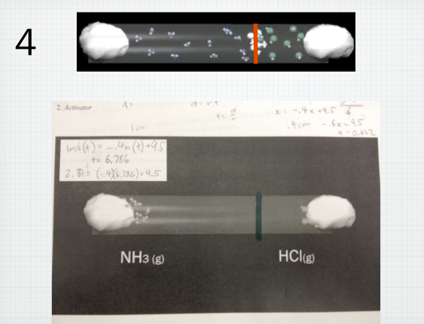
I always have a hard time teaching Graham’s law of effusion and diffusion. Not because the concept is hard to teach, but because it is something that is actually, so easy to teach. The calculation is not difficult (division and square root) and the concept is easy for students to grasp (lighter gases “move” faster). However, because this concept is, in my opinion, so easy to teach, I often miss an opportunity to facilitate real inquiry. In the past, out of a need to move quickly through the curriculum, I would do a 10 minute lecture on this concept, assign a bunch of practice problems, and that was it. Students got it, I moved through it, done and done. This year, I wanted to slow down and do something different with the concept. Although simple, the diffusion of gases through a medium is a concept that aligns horizontally well with their physics course, and also vertically with various concepts in biology. To better explore this concept, and given its relative simplicity, I tried to package and entire “Explore-Flip-Apply” lesson plan which would normally take 2-3 days into one period. Below is what I did: Step 1: Explore I showed students the below video clip and asked them to write down all the questions they had. Students unanimously asked the question: “Where will the gases meet?” Step 2: Flip Next I handed out a document to students with a screenshot of the tube shown in the video and asked students to predict where they would meet by drawing a line. I circulated and watched students negotiate this process. Most students started by calculating the molar mass of ammonia and hydrogen chloride gas. Because hydrogen chloride is roughly 2 times the molar mass of ammonia, students instinctively hypothesized that ammonia would diffuse twice as fast. Although incorrect, this was a victory in that students conceptually understood that at the same temperature, a gas with a smaller molar mass will diffuse faster than its heavier counterpart. At this point I strategically had the class stop working, and brought the class together. I told students that their conceptual understanding was correct, but their quantitative reasoning was incorrect. To negotiate this, instead of lecturing, I directed students to read about Graham’s law in their text individually for 5 minutes. This was the “flip” because rather than lecture to the entire class, I allocated lower Blooms to content to students to work through individually at their own pace. Student then discussed their readings with their group members, and revise their drawings accordingly. Groups then took pictures of their revisions, and posted to their blogs. Below is a screenshot: While students uploaded their blogs during class, I worked at my desk copying each image from their blogs into keynote slides. I copied an image of the correct answer (which will be revealed to students in the “apply” phase below) above each of their images. Below is a screenshot: Step 3: Apply Once I had all group images copied into the keynote presentation, I played the below video, which is the complete version of the “explore video”: After I played the video, I then revealed each slide and students voted on the group who’s solution was the closest to the actual solution. Students shared their strategies, completed a few practice problems, and wrote their own problem for their peers to solve. All in all, the process took 60 minutes total, and was, in my opinion, a much more useful, productive and critical way to learn about Graham’s law.
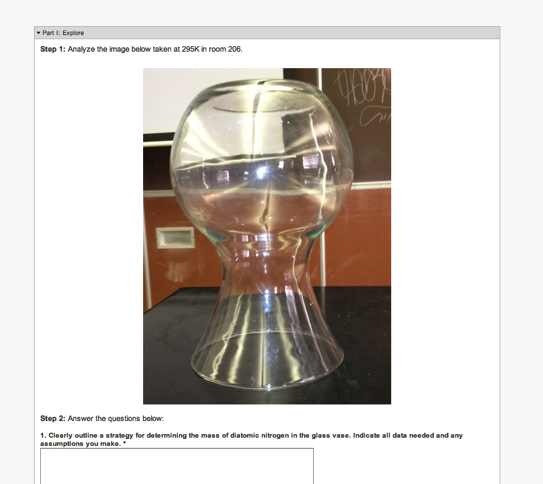
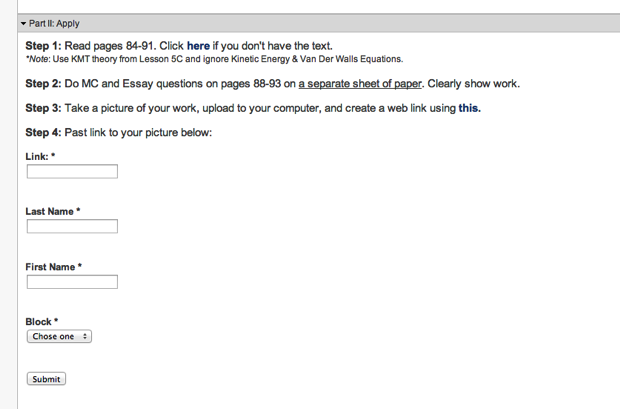
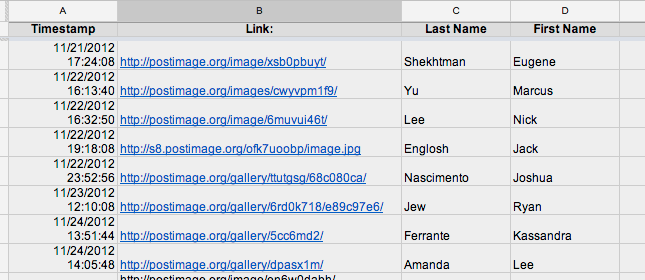
Although I am against assigning problems for students to do over holidays, the realities of teaching an AP curriculum sometimes demand that I do. This Thanksgiving break came directly in the middle of a Level (Unit) on gases, so I wanted my students to stay sharp over break. Instead of assigning problems, I asked students participate in the same inquiry process, beginning with higher Blooms (exploration/creation), ending with application (solving problems, discussion, etc.) that we participate in during the normal school year. First I posed a situation by posting an image along with a set of questions via a google form. See screenshot below or click here for the assignment page. After students participated in the “exploration” (essentially an experimental design problem), I assigned the typical “Read blah blah and do problems blah blah on page blah blah”. Instead of having students bring in the hard copy of their problems, I wanted to create a catalog of their solutions so that I could analyze them for mistakes, misconceptions, etc. along with their experimental design above. To do this, I had students snap a pic of their solutions and post to a site called postimage.org and past their link in a Google form to create a single data base with links to all of their solutions. See screenshots below or click here for the assignment page. See screenshot of spreadsheet below, or click here for live sheet. In order to guarantee that students were “locked” into the inquiry cycle (participated in the exploration prior to the application), I told students they would receive three points for the assignment: 1 point for the exploration, 1 point for the application and 1 point if their exploration submission is time-stamped prior to their application time-stamp. Although it seems like a like or work to sift through (and it was) organizing all things via two google forms that are individually time-stamped added efficacy (I think) to a process (homework) that I often feel can be very ineffective in that I was able to keep students questioning and forming hypothesis prior to application, which is the goal of our inquiry driven classroom structure. Moreover, the paperless turn-in allowed me to assess student work prior to class to facilitate a more critical and informed class the first day back.
|
Categories
All
Archives
March 2024
|
 RSS Feed